
AGV Drive Motor Sizing & Selection
Size an AGV drive motor: estimate torque, RPM and battery current for supplier review.
Request sizing reviewPublished & source-reviewed · Preliminary engineering model
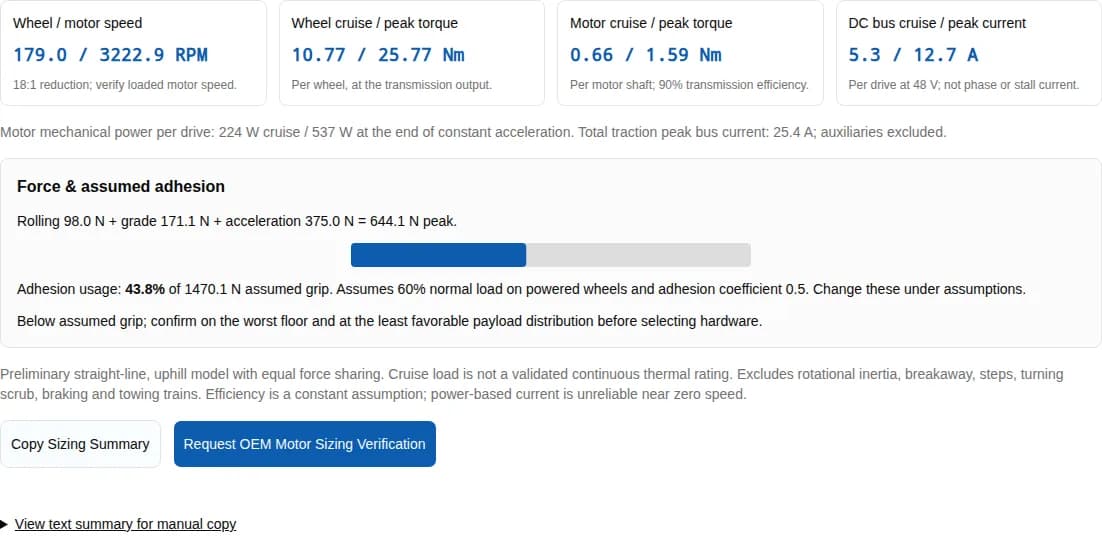
Wheel / motor speed
179.0 / 3222.9 RPM
18:1 reduction; verify loaded motor speed.
Wheel cruise / peak torque
10.77 / 25.77 Nm
Per wheel, at the transmission output.
Motor cruise / peak torque
0.66 / 1.59 Nm
Per motor shaft; 90% transmission efficiency.
DC bus cruise / peak current
5.3 / 12.7 A
Per drive at 48 V; not phase or stall current.
Motor mechanical power per drive: 224 W cruise / 537 W at the end of constant acceleration. Total traction peak bus current: 25.4 A; auxiliaries excluded.
Force & assumed adhesion
Rolling 98.0 N + grade 171.1 N + acceleration 375.0 N = 644.1 N peak.
Adhesion usage: 43.8% of 1470.1 N assumed grip. Assumes 60% normal load on powered wheels and adhesion coefficient 0.5. Change these under assumptions.
Below assumed grip; confirm on the worst floor and at the least favorable payload distribution before selecting hardware.
Preliminary straight-line, uphill model with equal force sharing. Cruise load is not a validated continuous thermal rating. Excludes rotational inertia, breakaway, steps, turning scrub, braking and towing trains. Efficiency is a constant assumption; power-based current is unreliable near zero speed.
View text summary for manual copy
Four decisions to make before selecting a motor
| Decision | Why it changes selection | Basis |
|---|---|---|
| Separate wheel and motor ratings | Reduction trades wheel speed for torque. Match supplier ratings at the correct shaft. | Force and power equations below |
| Screen grip before buying more torque | Higher available motor torque cannot overcome insufficient floor adhesion. | Measured wheel-load and floor test plan |
| Treat DC current as a battery estimate | Phase current and zero-speed torque require motor and drive data. | maxon input vs motor current |
| Validate the vehicle, not just a component | Thermal mission performance and stopping/holding remain outside this calculator. | IEC motor scope and ISO vehicle scope |
How the sizing model works
Uphill straight-line motion, constant acceleration, rigid-body mass and equal drive-wheel force sharing are assumed. M is gross vehicle mass in kg, D is loaded diameter in metres, N is powered-wheel count, θ is incline in degrees, i is motor-to-wheel reduction, and η values below are fractions.
| Quantity | Equation | Meaning / limitation |
|---|---|---|
| Rolling force (N) | F_roll = M × g × c_rr × cos(θ) | c_rr is dimensionless rolling resistance, distinct from adhesion. |
| Grade force (N) | F_grade = M × g × sin(θ) | Uphill only; no downhill/braking model. |
| Cruise / acceleration peak (N) | F_cruise = F_roll + F_grade; F_peak = F_cruise + M × v / t | Rotating inertia, breakaway force, thresholds and steering scrub are excluded. |
| Wheel torque (Nm) | T_wheel = F × D / (2 × N) | Actual output-shaft demand before any design allowance. |
| Motor torque / speed | T_motor = T_wheel / (i × η_trans); n_motor = i × 60v / (πD) | Motor-shaft torque in Nm and speed in RPM; check the supplier envelope at both. |
| Mechanical power per motor (W) | P_motor = F × v / (N × η_trans) | Peak power occurs at the end of constant acceleration. |
| DC bus current per drive (A) | I_bus ≈ P_motor / (V_bus × η_elec) | Constant assumed efficiency, not a phase-current or stall-current limit. |
| Assumed grip (N) | F_grip = μ_adhesion × M × g × cos(θ) × powered load fraction | Compare total peak force to grip; wheel count alone does not determine normal load. |
These equations are our transparent first-pass model. The Oriental Motor AGV tool separately considers wheel/rotor inertia; use a detailed supplier model for final sizing. The input ranges are supported calculator limits, not operating permissions or product capabilities.
Three reproducible sizing examples
Illustrative calculations, not field case studies or product recommendations. These are the same presets available in the calculator. Each uses 18:1 reduction, 88% assumed motor-plus-inverter efficiency, 60% powered-wheel normal load and 0.5 assumed adhesion. No design allowance is included.
| Example | Mass / wheels | Speed / accel time / incline | Diameter / rolling coeff. | Transmission / bus |
|---|---|---|---|---|
| Warehouse AMR (500 kg) | 500 kg / 2 | 1.5 m/s / 2 s / 2° | 160 mm / 0.02 | 90% / 48 V |
| Heavy Pallet AGV (1500 kg) | 1500 kg / 2 | 1 m/s / 2.5 s / 3° | 200 mm / 0.022 | 88% / 48 V |
| Light Service AMR (200 kg) | 200 kg / 2 | 1.2 m/s / 1.5 s / 1.5° | 125 mm / 0.018 | 92% / 24 V |
| Example | Wheel / motor RPM | Wheel cruise / peak Nm | Motor cruise / peak Nm | Motor cruise / peak W | Bus cruise / peak A |
|---|---|---|---|---|---|
| Warehouse AMR (500 kg) | 179.0 / 3222.9 | 10.77 / 25.77 | 0.66 / 1.59 | 224 / 537 | 5.3 / 12.7 |
| Heavy Pallet AGV (1500 kg) | 95.5 / 1718.9 | 54.65 / 84.65 | 3.45 / 5.34 | 621 / 962 | 14.7 / 22.8 |
| Light Service AMR (200 kg) | 183.3 / 3300.2 | 2.71 / 7.71 | 0.16 / 0.47 | 57 / 161 | 2.7 / 7.6 |
For the standard 500 kg AMR: rolling force 98.0 N + grade force 171.1 N + acceleration force 375.0 N gives 644.1 N peak. At 18:1, the motor needs 1.59 Nm at 3222.9 RPM before omitted loads or allowances. Check breakaway and the repeated thermal cycle next.
Prepare a supplier RFQ from your result
The pallet example makes grade and holding validation especially important. The light AMR example uses 24 V, so verify battery and drive current alongside packaging. None of these examples selects a brake or guarantees a payload rating.
AGV drive motor selection by vehicle architecture
| Vehicle | Layout | Candidate architecture | Decision boundary |
|---|---|---|---|
| Differential AMR | Two driven wheels with passive casters | Geared BLDC/PMSM wheel modules | Check weight transfer and turning scrub; straight-line equal sharing is only a first estimate. |
| Pallet AGV | Steerable drive or differential traction | Drive unit with documented bearing and brake ratings | Check wheel load, ramp startup, thermal path and brake handoff at full load. |
| Mecanum / swerve | Four independently controlled wheels | Dedicated omnidirectional wheel or steer-drive modules | The calculator does not model roller forces, lateral motion or steering torque. Request kinematic sizing. |
| Tow tugger | Tractor plus trailers | Traction unit sized from drawbar force | Trailer mass adds force but not tractor grip. Do not enter total train mass into this adhesion model. |
| Drive layout | Potential benefit | Cost / integration trade-off | Request before selection |
|---|---|---|---|
| In-wheel hub / geared wheel | Compact wheel module can free chassis space. | Cooling, impact load path and tire service may be constrained. | Wheel bearing loads, sealing, thermal curves, tire replacement access. |
| Offset geared drive | Motor and brake can be positioned for access. | Gear alignment, couplings and suspension add parts and space. | Gear efficiency, allowable output loads, backlash and mounting tolerances. |
| Low-ratio / QDD drive | Lower reduction can aid backdrivability and force response. | Motor and inverter may need higher torque/current for the same wheel demand. | Loaded push force, holding design, thermal envelope and output bearing data. |
| BLDC/PMSM with FOC | Closed-loop torque control can support smooth creep. | Performance depends on winding, sensing and control tuning, not the label alone. | Measured low-speed behavior, phase-current convention, encoder and fault response. |
Measure floor resistance and grip separately
Rolling resistance costs energy; adhesion limits transferable force. Wheel material, diameter, load and floor condition all matter. Blickle’s guide compares wheel properties, but it does not validate the calculator defaults for your floor.
| Measurement | Method / record | How to use it |
|---|---|---|
| Gross mass and powered normal load | Weigh loaded/unloaded vehicle and each driven contact; include payload shifts and ramps. | Enter the least favorable powered-wheel normal-load percentage. |
| Rolling resistance | Measure level-floor steady tow force at relevant load and speed; record force and test conditions. | First estimate c_rr = tow force / (M × g), accounting for other measured drag. |
| Adhesion | Measure onset of slip with the actual tire and representative floor contamination under a controlled test. | First estimate μ_adhesion = limiting force / driven-wheel normal force. |
| Breakaway and thresholds | Record initial pull after dwell and force over the worst relevant joint. | Add these loads in detailed sizing; this calculator does not include them. |
In the model, increasing wheel diameter increases torque in proportion to radius but leaves F_peak and F_grip unchanged. To improve a failed adhesion check, revise acceleration demand or measured grip/load conditions. Do not infer safe handling from the colored result bar.
Check the complete mission thermal duty
The cruise torque is not an S1 or other duty approval. A first RMS screen is T_RMS = √[Σ(T² × time) / Σ(time)]. It assumes losses track torque squared sufficiently closely and cooling is comparable across the cycle; speed-dependent losses and cooling can invalidate that simplification.
| Phase | Duration (s) | Motor torque (Nm) | Status |
|---|---|---|---|
| Acceleration | 2 | 1.590 | Derived from the 500 kg preset. |
| Uphill cruise | 20 | 0.665 | Derived from the 500 kg preset. |
| Deceleration (assumed) | 2 | -0.400 | Chosen illustration; replace with measured mission data. |
| Station dwell (assumed) | 16 | 0.000 | Chosen illustration; replace with measured mission data. |
This example gives 0.596 Nm RMS. Compare against the actual motor torque-speed/thermal curve, at the enclosure temperature and mounting conditions. Also check every peak magnitude and duration. A generic insulation class cannot supply a universal derating percentage. Confirm the duty definitions and supplier test conditions against the applicable motor rating reference.
Battery current, phase current and voltage trade-offs
For the standard example’s 537 W mechanical peak per motor and assumed 88% combined electrical efficiency, the table changes only DC bus voltage. It assumes the same achievable mechanical operating point at every voltage.
| Bus voltage | DC peak per drive | Two-drive traction total | Phase-current rating |
|---|---|---|---|
| 24 V | 25.4 A | 50.8 A | Unknown: obtain Kt and current convention from supplier. |
| 48 V | 12.7 A | 25.4 A | Unknown: obtain Kt and current convention from supplier. |
| 72 V | 8.5 A | 16.9 A | Unknown: obtain Kt and current convention from supplier. |
Higher voltage lowers bus current at the same electrical power. For an unchanged cable resistance, halving its current quarters that cable’s resistive loss. Motor phase current and winding loss do not follow directly from bus voltage. At start or hold, use torque constant and controller limits; see maxon’s explanation.
Braking, holding and recovery require a separate design
For an illustrative 1,500 kg vehicle at 1.5 m/s, translational kinetic energy is ½Mv² = 1,687.5 J before rotating inertia or ramp potential energy. This is an energy budget, not a resistor or brake rating. Check battery charge acceptance at full charge and cold temperature, as well as drive overvoltage behavior.
A braking chopper design needs activation voltage, allowable minimum resistance, switching-current limits, pulse energy, repetition rate and thermal protection from the drive supplier. A holding brake needs documented torque, engagement time and failure behavior at the relevant shaft. Regeneration by itself does not establish power-off holding.
The ISO 3691-4 public scope supports vehicle-level safety review. This page does not infer a mandatory brake technology or Performance Level from that scope. Check full applicable requirements and risk assessment with the integrator. Manual brake release or towing needs a controlled recovery procedure that prevents unintended rollback.
Integration risks, costs and alternatives
| Risk | Consequence | Mitigation / alternative | Cost to include |
|---|---|---|---|
| Misuse of cruise output as a rated motor selection | Overheating or failed ramp restart. | Verify measured mission, inertia and breakaway loads with supplier curves. | Thermal testing, prototype drive and cooling changes. |
| Poor traction or unequal wheel loads | Slip, odometry error and missed acceleration target. | Measure worst-case grip; alter ramp demand, suspension or load distribution. | Tread wear, suspension and commissioning time. |
| Floor impacts and tight-turn scrub | Unmodeled bearing, gear and motor loads. | Test worst joints/turns; consider suspension or a different drive layout. | Bearing/gear replacements and service access. |
| Battery cannot absorb regeneration | Bus overvoltage and interrupted braking control. | Validate BMS/drive energy path; engineer energy dissipation if needed. | Chopper, resistor, cooling and validation. |
| Mecanum, towing, steep transitions or outdoor floors | Straight-line model no longer describes the mission. | Use architecture-specific kinematics, drawbar measurements or terrain model. | Specialist sizing and representative site tests. |
| Fieldbus label treated as compatibility proof | Unsupported operating mode or fault sequencing. | Check actual CiA 402 objects, modes and network timing; test recovery. | Controller integration and diagnostics; see source below. |
Evidence, review date and known limits
Published by QDD Motors, a commercial motor supplier. This is a reproducible engineering worksheet, not independent product testing or customer testimony. Sources checked November 1, 2026; review again by May 1, 2027, or sooner if a source or model changes. Calculated examples are our model outputs; defaults are explicit illustrative assumptions. Public standard summaries establish scope, not clause-level design approval. Product-specific torque, efficiency, thermal derating, acoustic and bearing data remain unknown until a supplier provides them.
| Source | What it supports | Boundary / unknown |
|---|---|---|
| Oriental Motor — AGV sizing tool | Independent sizing reference with mass, wheel, friction and inertia inputs. | Our calculator is a simplified rigid-body model; it omits rotating inertia and does not reproduce the supplier tool. |
| maxon — Input current vs. motor current | PWM drive input current and motor current are different quantities. | Our DC estimate uses mechanical power and an assumed combined efficiency; it cannot specify phase-current limits. |
| Blickle — Wheel series guide | Wheel selection compares tread hardness, rolling resistance and load-related properties. | This guide does not establish universal floor coefficients. Our 0.02 rolling and 0.5 adhesion defaults are illustrative inputs, not certified material data. |
| IEC 60034-1:2026 — Rating and performance | Current motor rating reference; the public catalog describes motor-component scope within a power drive system. | The linked RLV includes the standard and a comparison with the previous edition. Public scope does not establish a thermal derating curve or peak-duration guarantee for a specific motor. |
| ISO 3691-4:2023 — Driverless industrial trucks | Public scope includes AGVs and AMRs and addresses vehicle/system safety verification. | Scope is not a clause-level brake specification. Confirm the applicable edition and full requirements with a competent vehicle integrator; this page does not establish compliance. |
| CAN in Automation — CiA 402 series | Defines drive behavior, state machine, operating modes and process data. | Vendor implementations vary. Verify actual supported modes and timing; a profile name does not guarantee application synchronization. |
Turn the preliminary result into a reviewable RFQ
| Provide | Ask the supplier to return | Acceptance evidence |
|---|---|---|
| Calculator summary plus measured inputs and uncertainty | Matched motor/gear/drive operating points at the correct shafts | Torque-speed curve, gear ratio, efficiency and peak duration. |
| Mission profile, mounting and enclosure temperature | Thermal model and cooling requirements | Repeated representative full-load cycles without exceeding documented limits. |
| Battery range, DC budget and regenerative energy | Phase-current limits, Kt convention and charge/dissipation design | Loaded speed, startup current and full/cold-battery braking tests. |
| CAD, wheel loads, floor joints and recovery requirements | Bearing loads/life, brake and service information | Drawings and vehicle-level test plan for the actual environment. |
| Safety concept, network modes, quantity and delivery target | Documented safety interfaces, supported objects and commercial terms | Integrator review, fault recovery tests, price, lead time and warranty. |
AGV drive motor questions
Sizing and thermal limits
How do I size an AGV drive motor?
Estimate straight-line rolling, grade and acceleration forces first. Convert force to wheel torque, then divide by gear ratio and transmission efficiency to obtain motor-shaft torque. Check motor speed, mission thermal duty, breakaway loads, grip and braking before choosing a model.
Are wheel torque and motor torque the same?
Only for an ideal direct drive. For reduction ratio i = motor speed / wheel speed, motor torque = wheel torque / (i × transmission efficiency). Wheel torque is measured at the gearbox output; motor torque is measured at its input.
Does the cruise result prove continuous thermal capability?
No. It is steady uphill mechanical demand at the entered speed. Check the whole mission, cooling, ambient temperature, motor losses and supplier torque-speed limits. An RMS torque screen can help but does not replace thermal validation.
How much peak torque reserve is required?
There is no universal multiplier. Include measured breakaway force, rotating inertia, steps, ramp transitions and acceleration. Obtain the supplier torque-speed envelope, peak duration and recovery limits, then validate repeated mission cycles.
Electrical and floor inputs
Can I use estimated DC current to set phase-current limits?
No. DC bus current is a power-based battery estimate. Phase current depends on torque constant, commutation, speed and RMS/peak conventions. Holding or starting torque can require high phase current at nearly zero mechanical power.
Should I use 24 V or 48 V?
At equal input power, 48 V draws half the DC bus current of 24 V. This does not imply half the motor phase current or a universal winding-loss saving. Check motor winding voltage, minimum loaded battery voltage, drive limits, cable losses and battery cost.
Which floor coefficients should I enter?
Measure rolling resistance and available adhesion separately with the actual tread, payload, floor and contamination. Defaults are illustrative. Hardness alone does not establish either coefficient, and breakaway force may exceed rolling force after a long parked dwell.
How do I recover from a wheel-slip warning?
Increase acceleration time, reduce requested speed or grade, improve tread grip or adjust wheel loading after checking stability. A larger wheel increases torque required for the same force; it does not alone improve the force-based adhesion margin in this model.
Architecture, safety and sourcing
Can I size a tow train with total mass?
Not with this calculator alone. Tractor and trailers can have different rolling resistance and grades. Grip is limited by normal load on the tractor driven wheels. Measure drawbar force and size the tractor separately.
Does regenerative braking hold an AGV on a ramp?
Energy regeneration alone does not establish power-off holding. Validate stopping, stationary holding and failure behavior for the complete vehicle. An appropriately sized power-off brake is one possible design measure, subject to the applicable requirements and risk assessment.
Which is better: hub, offset geared or QDD drive?
Compare packaging, load bearings, cooling, service access, brake integration and recovery effort. An in-wheel package can save space; offset gearing can simplify access; low-ratio QDD can improve backdrivability. None guarantees a load rating or safe manual push force without product data.
What should I send with a sizing inquiry?
Send measured vehicle mass, powered-wheel loads, floor conditions, wheel diameter, target speed, grade, acceleration, reduction ratio, battery range and full duty cycle. Include CAD, brake requirements, test conditions, quantities and delivery targets; attach the calculator summary as preliminary evidence.
Request AGV drive motor sizing verification
Send the copied summary, CAD and mission data so the team can review the assumptions and discuss suitable motor, gearing, feedback and drive options.
Inquiry Email
Include target torque/speed, quantity, and delivery location.
Instant Chat
WhatsApp Engineering Support
Opens a direct WhatsApp thread with the RFQ message prefilled.
Related decisions: AGV frameless motor in-wheel sizing · low-ratio geared motor options · warehouse automation integration · low-ratio QDD integration · absolute encoder BLDC feedback